ng2 Charts by Valor Software
A charting library written using TypeScript by the Valor Software who’ve introduced libraries like ngx-bootstrap and ng2-dracula.
Project website https://github.com/valor-software/ng2-charts
Documentation https://www.chartjs.org/docs/latest/
License MIT
Demos
1. General https://valor-software.com/ng2-charts/
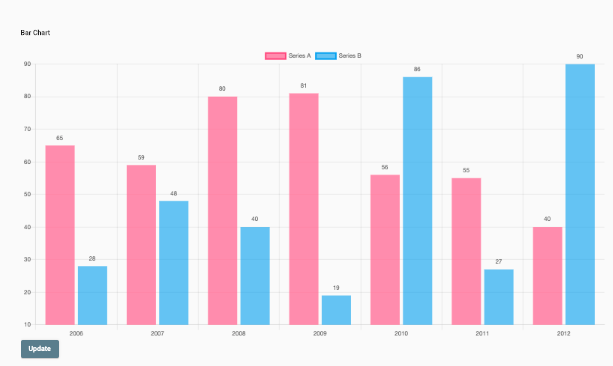
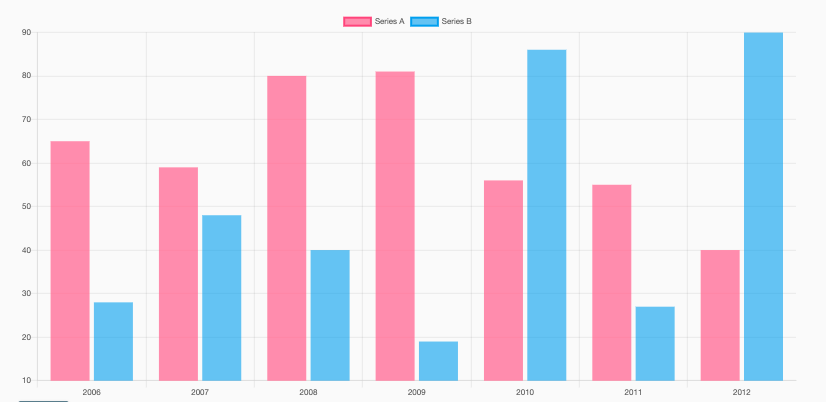
2. Bar Chart https://stackblitz.com/edit/ng2-charts-bar-template
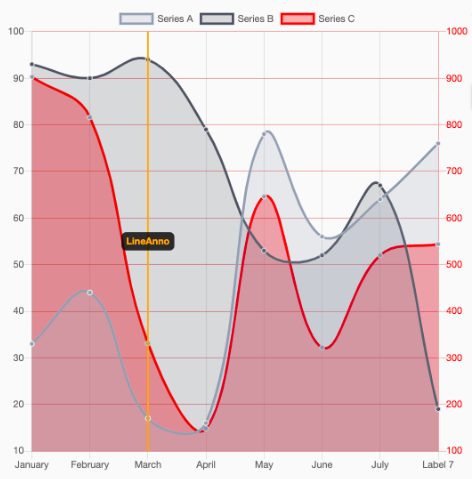
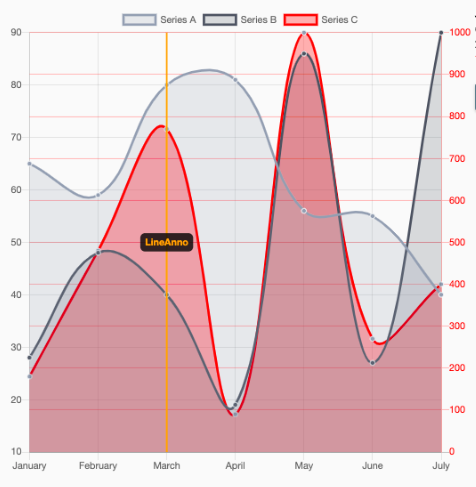
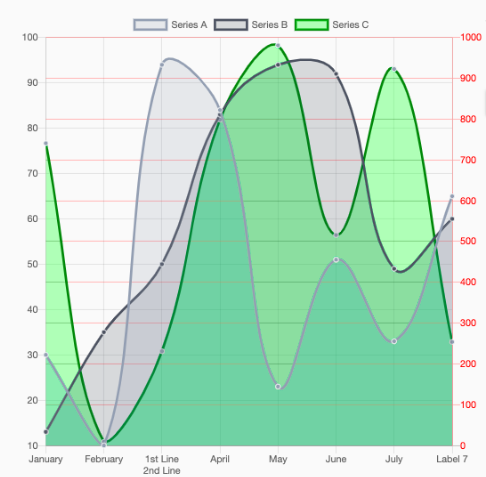
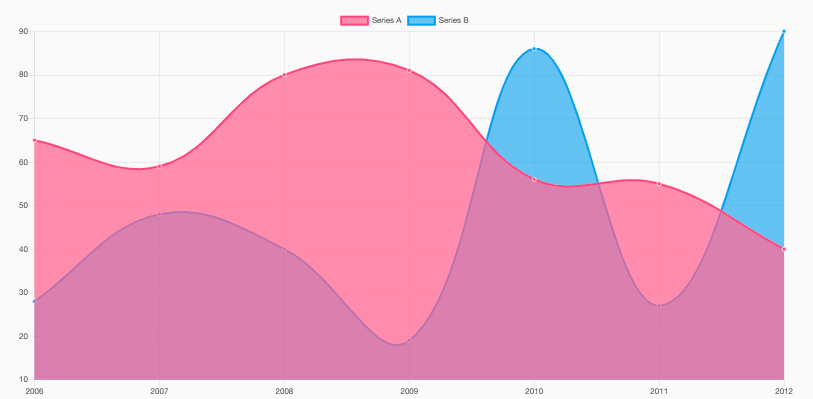
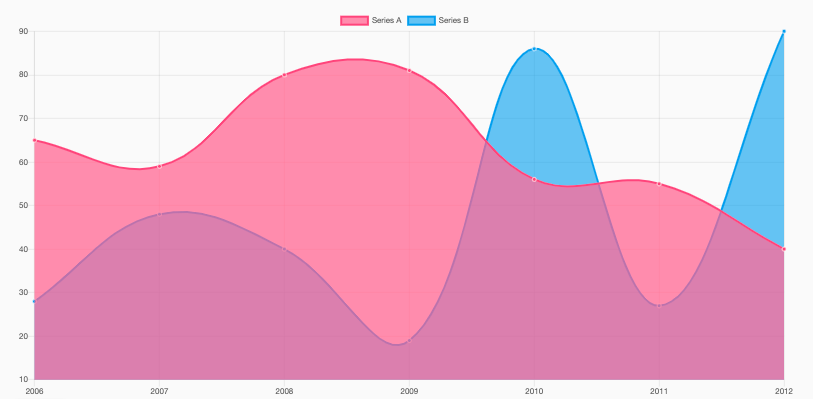
3. Line chart https://stackblitz.com/edit/ng2-charts-line-template
4. Bubble Chart https://stackblitz.com/edit/ng2-charts-bubble-template
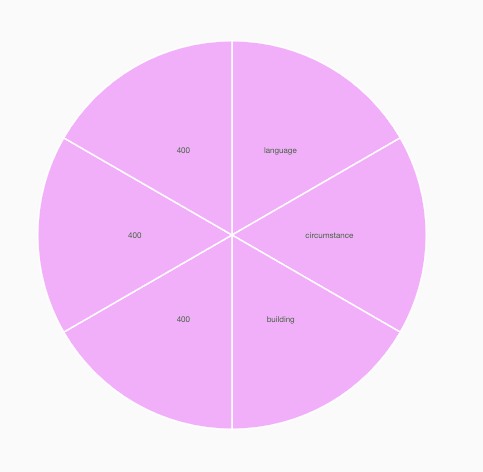
5. Pie Chart https://stackblitz.com/edit/ng2-charts-pie-template
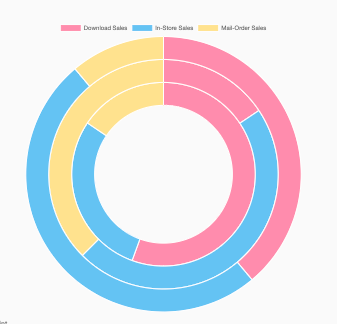
6. Doughnut Chart https://stackblitz.com/edit/ng2-charts-doughnut-template
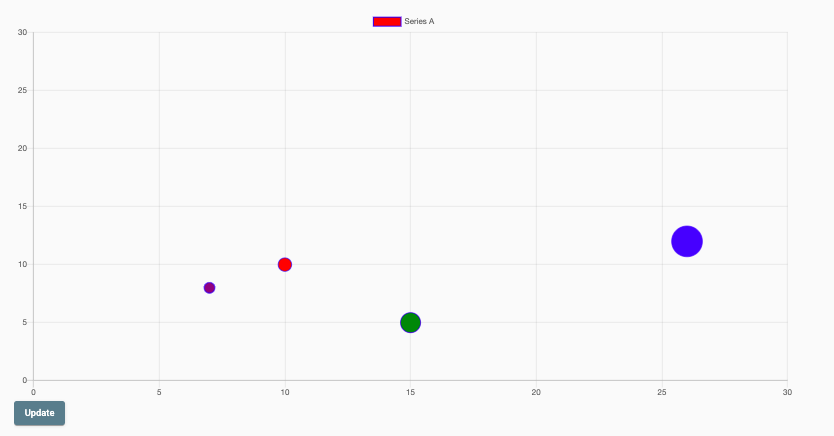
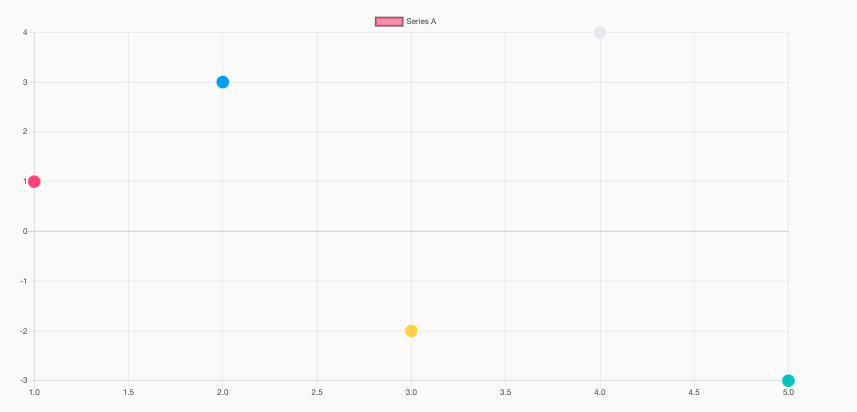
7. Scatter Chart https://stackblitz.com/edit/ng2-charts-scatter-template
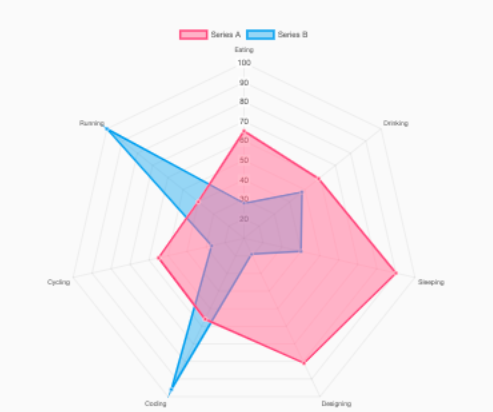
8. Radar Chart https://stackblitz.com/edit/ng2-charts-radar-template
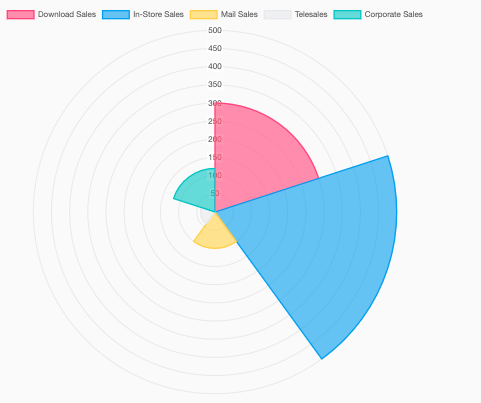
9. Polar Area Chart https://stackblitz.com/edit/ng2-charts-polar-area-template
Dependencies
| “@angular/animations”: “~8.0.0”, |
| “@angular/cdk”: “~8.0.0”, |
| “@angular/common”: “~8.0.0”, |
| “@angular/compiler”: “~8.0.0”, |
| “@angular/core”: “~8.0.0”, |
| “@angular/forms”: “~8.0.0”, |
| “@angular/material”: “^8.0.0”, |
| “@angular/platform-browser”: “~8.0.0”, |
| “@angular/platform-browser-dynamic”: “~8.0.0”, |
| “@angular/router”: “~8.0.0”, |
| “chart.js”: “^2.8.0”, |
| “chartjs-adapter-luxon”: “^0.2.0”, |
| “chartjs-plugin-annotation”: “^0.5.7”, |
| “chartjs-plugin-datalabels”: “^0.6.0”, |
| “core-js”: “^3.1.3”, |
| “highlight.js”: “^9.15.8”, |
| “luxon”: “^1.15.0”, |
| “marked”: “^0.6.2”, |
| “ngx-highlightjs”: “^3.0.3”, |
| “ngx-markdown”: “^7.1.5”, |
| “prismjs”: “^1.16.0”, |
| “rxjs”: “~6.5.2”, |
| “zone.js”: “^0.9.1” |
NPM
https://www.npmjs.com/package/ng2-charts
npm i ng2-charts
Features
- canvas made
- CSS customizable border, fonts, padding, background-color and gradient
- fresh look
- legend configuration: width, events, position (top, bottom, left, right), font (size, family, style, color, padding), support for HTML legend
- title configuration: font (family, size, style, padding, color), padding, height, position (top, bottom, right, left)
- tooltip customization: toggle, intersect, position (average, nearest), ite, sort, callbacks, background-color, fonts (size, family, style, color) for footer, body and title, spacing, margin, caret size and padding, border color and width
- line configuration: tension, background-color, border (width, color, cap style, dash dash offset, join style), brazier control,
- point configuration: radius, style (‘circle’, ‘cross’, ‘crossRot’ ,’dash’, ‘line’, ‘rect’, ‘rectRounded’, ‘rectRot’, ‘star’, ‘triangle’), rotatiomn, border color and width, background-color, hit radius hover radius and hover border width
- rectangle configuration: background-color, border (width, color, excluding borders)
- detailed chart configuration that allows to change styling (colors, widths, alignment, borders, labels) and react on callbacks depending on the chart type
- axes configuration: display, weight, callbacks (beforeUpdate, beforeSetDimensions, afterSetDimensions, beforeDataLimits, afterDataLimits, beforeBuildTicks, afterBuildTicks, beforeTickToLabelConversion, afterTickToLabelConversion, beforeCalculateTickRotation, afterCalculateTickRotation, beforeFit, afterFit, afterUpdate)
- tick configuration (cartesian axes settings): skip, padding, rotation, padding, offset, and tick formats
- axis IDs
- creating multiple axes
- radial axes
- labelling axes and their configuration (heigh, color, font configuration, padding)
- arc configuration: background-color, border (width, color, alignment)
- animations: duration, easing, onProgress, onComplete. Easing: ‘linear’, ‘easeInQuad, ’’easeOutQuad’, ‘easeInOutQuad’, ‘easeInCubic’, ‘easeOutCubic’, ‘easeInOutCubic’, ‘easeInQuart’, ‘easeOutQuart’, ‘easeInOutQuart’, ‘easeInQuint’, ‘easeOutQuint’, ‘easeInOutQuint’, ‘easeInSine’, ‘easeOutSine’, ‘easeInOutSine’, ‘easeInExpo’, ‘easeOutExpo’, ‘easeInOutExpo’, ‘easeInCirc’, ‘easeOutCirc’, ‘easeInOutCirc’, ‘easeInElastic’, ‘easeOutElastic’, ‘easeInOutElastic’, ‘easeInBack’, ‘easeOutBack’, ‘easeInOutBack’, ‘easeInBounce’, ‘easeOutBounce’, ‘easeInOutBounce’.
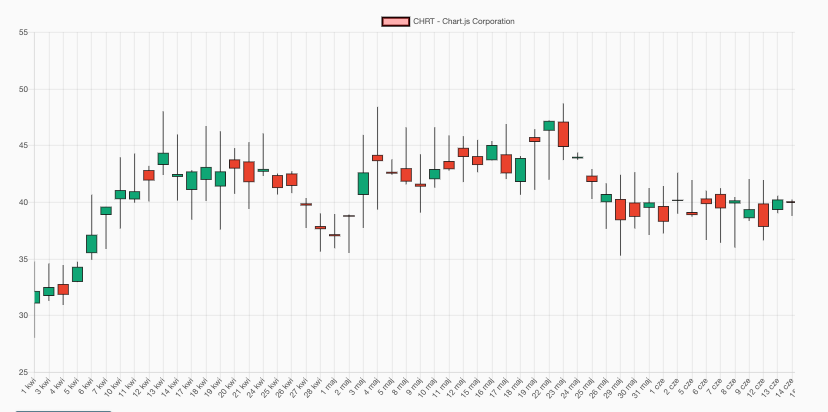
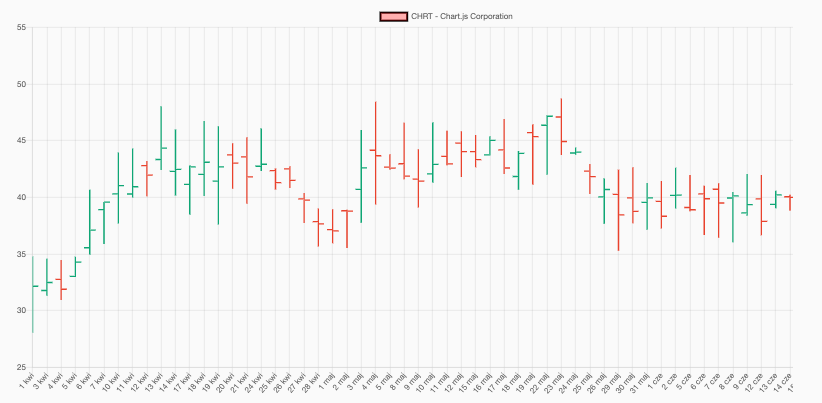
- chart types: financial chart, dynamic chart, scatter chart, bubble chart, polar area chart, pie chart, radar chart, doughnut chart, bar chart, and line chart
- upading data and options
- supports Angular 7
- ARIA support
- responsiveness and ratio
- events: onHover, onClick
- tooltip modes point, nearest, index, dataset, x, and y
- comparision table https://www.chartjs.org/docs/latest/notes/comparison.html