ng2 nvd3 by Krispo
An Angular component made for the NVD3 library which is based on d3.js. Available from Angular 2.
Project website https://github.com/krispo/ng2-nvd3
Documentation https://github.com/brillout/awesome-angular-components
License MIT
Demos
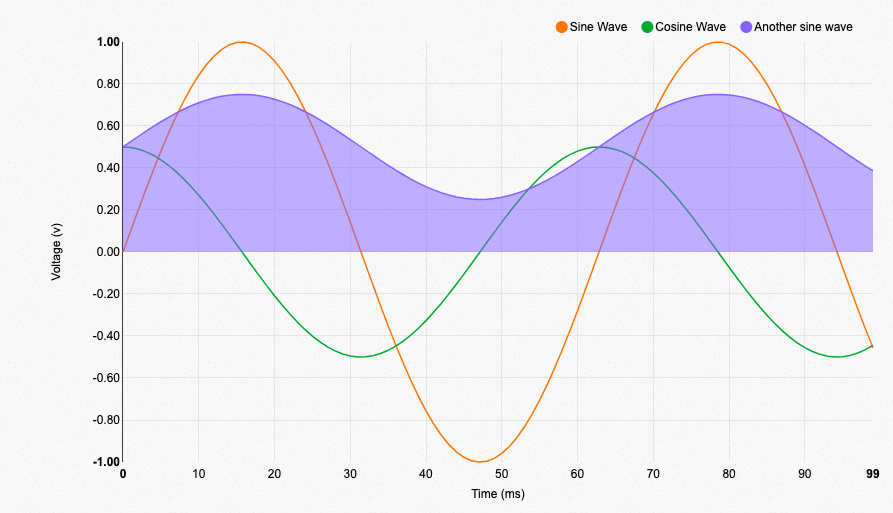
1. Simple line chart http://nvd3.org/examples/line.html
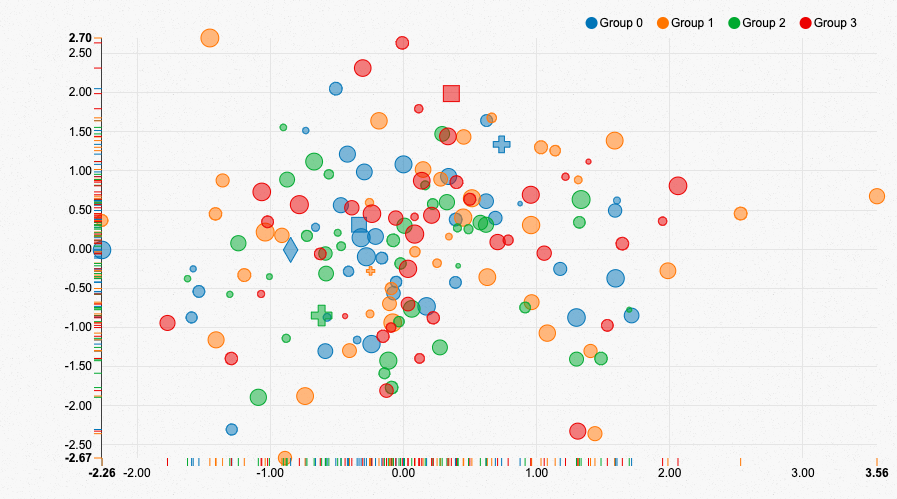
2. Scatter / bubble chart http://nvd3.org/examples/scatter.html
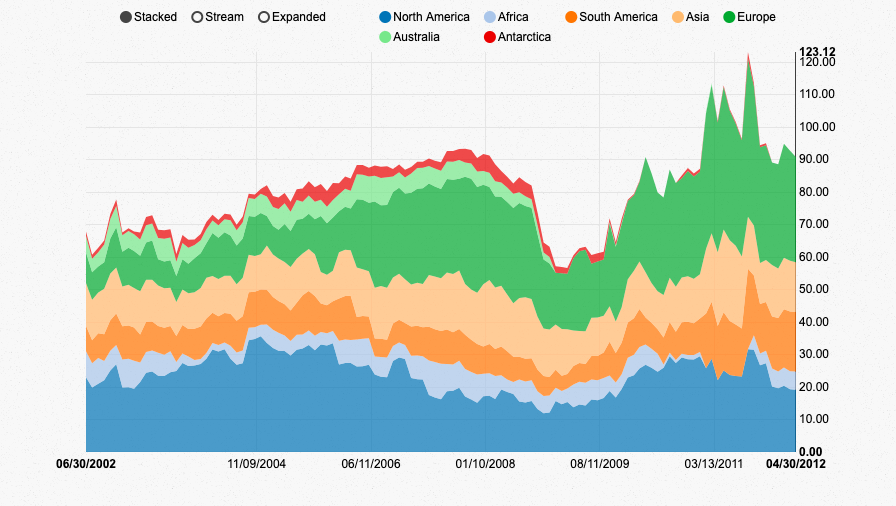
3. Scated area chart http://nvd3.org/examples/stackedArea.html
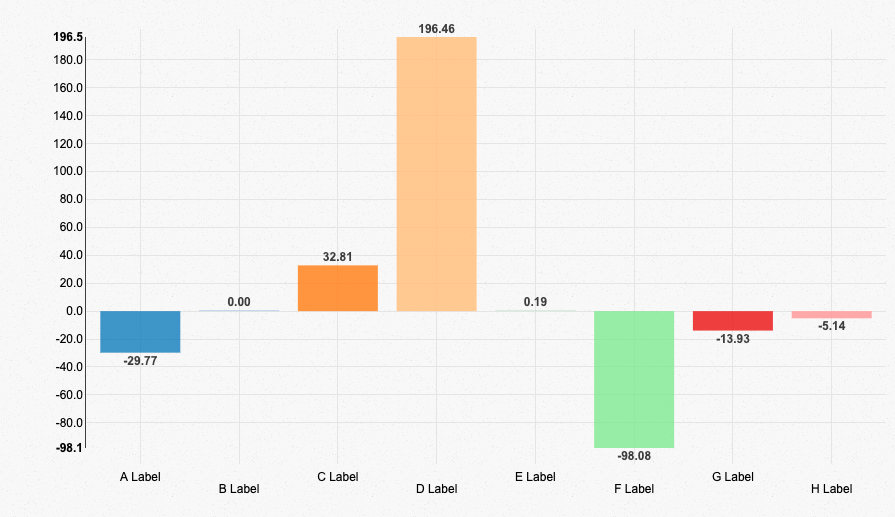
4. Discrete bar chart http://nvd3.org/examples/discreteBar.html
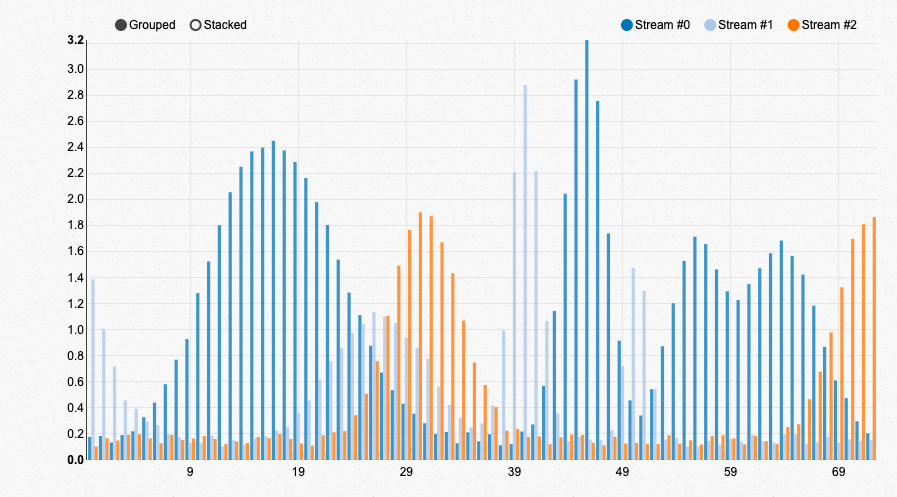
5. Stacked/Grouped Multi-Bar Chart http://nvd3.org/examples/multiBar.html
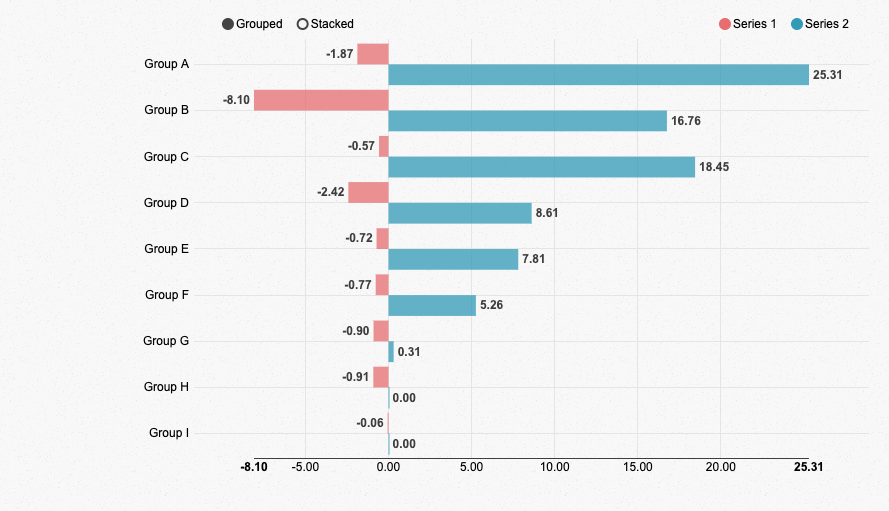
6. Horizontal bar chart http://nvd3.org/examples/multiBarHorizontal.html
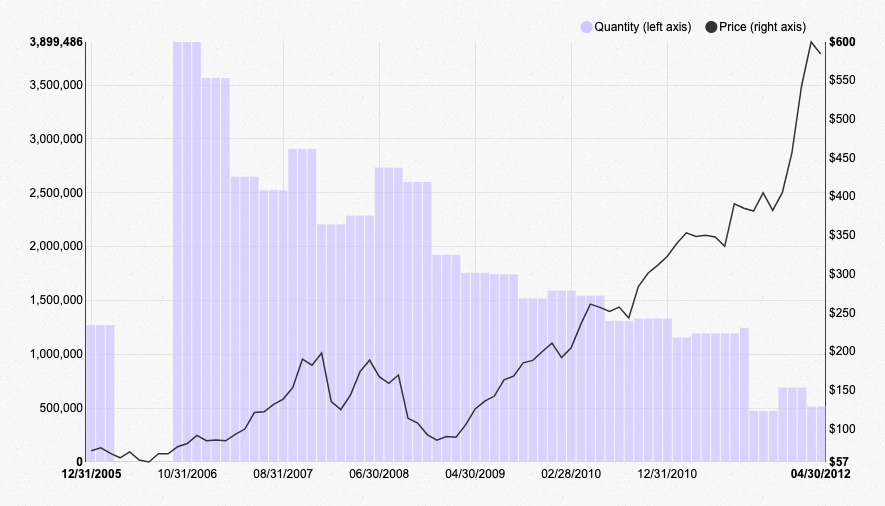
7. Line bar chart http://nvd3.org/examples/linePlusBar.html
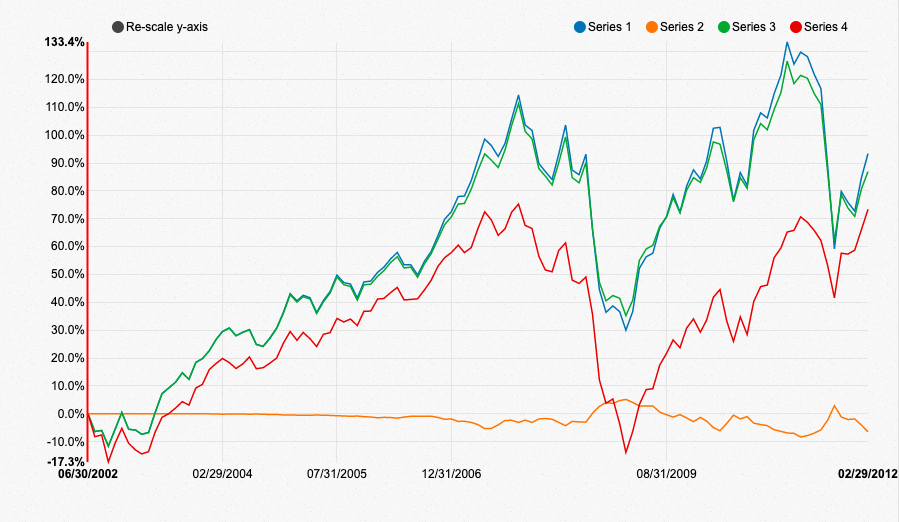
8. Cumulative line chart http://nvd3.org/examples/cumulativeLine.html
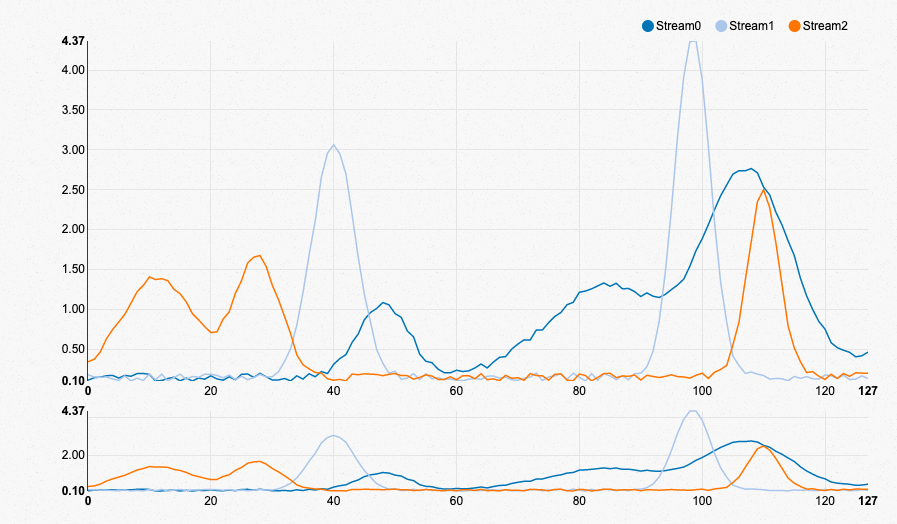
9. Line chart + View Finder http://nvd3.org/examples/lineWithFocus.html
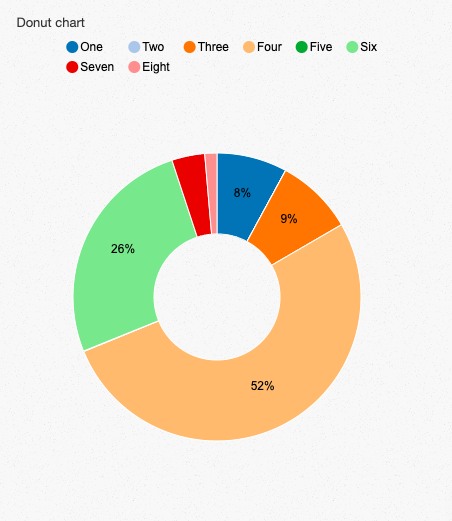
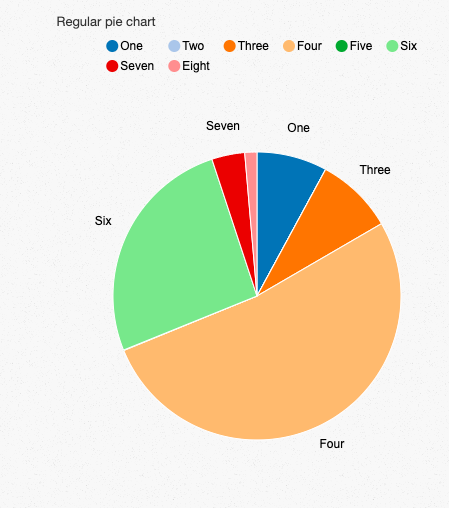
10. Pie chart http://nvd3.org/examples/pie.html
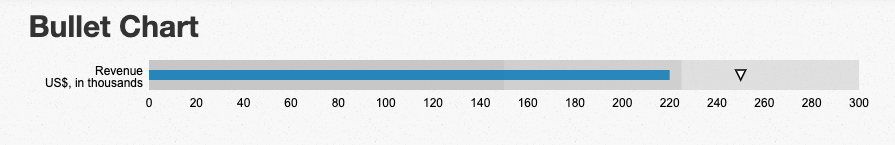
11. Bullet chart http://nvd3.org/examples/bullet.html
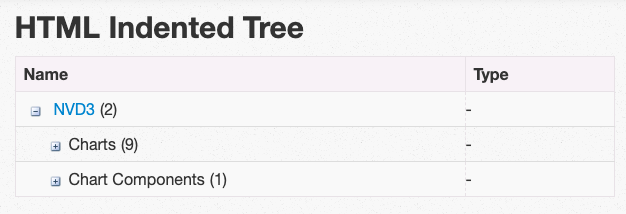
12. HTML intended tree http://nvd3.org/examples/indentedtree.html
Dependencies
| “reflect-metadata”: “^0.1.10”, |
| “rxjs”: “5.2.0”, |
| “d3”: “^3.5.15”, |
| “nvd3”: “^1.8.5” |
NPM
https://www.npmjs.com/package/ng2-nvd3
npm i ng2-nvd3
Features
- types: line chart, bar chart, bubble chart, scatter chart, scated area chart, grouped multi-bar chart, horizontal bar chart, line bar chart, pie chart, bullet chart (rare for other libraries), line chart with a finder, cumulative line chart, candlestick chart,
- styling: height margin (top, bottom, left, right)
- callbacks: stateChange, changeState, tooltipShow, tooltipHide
- x/y axis label configuration
- tick format
- duration configuration
- label threshold
- stacking for bar chart
- sowing max/min values for candlestick chart
- limiting sizes for plotBox chart
- changing colors
- changing font size