ngx Charts by Swimlane
Rendering engine in Angular for displaying charts using D3 to calculate chart logic. It has full documentation with a complete list of examples.
Project website https://github.com/swimlane/ngx-charts
Documentation https://swimlane.gitbook.io/ngx-charts/
License MIT
Demos
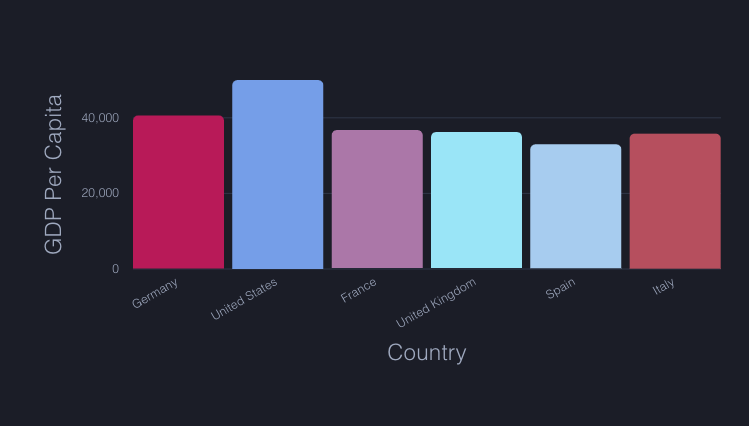
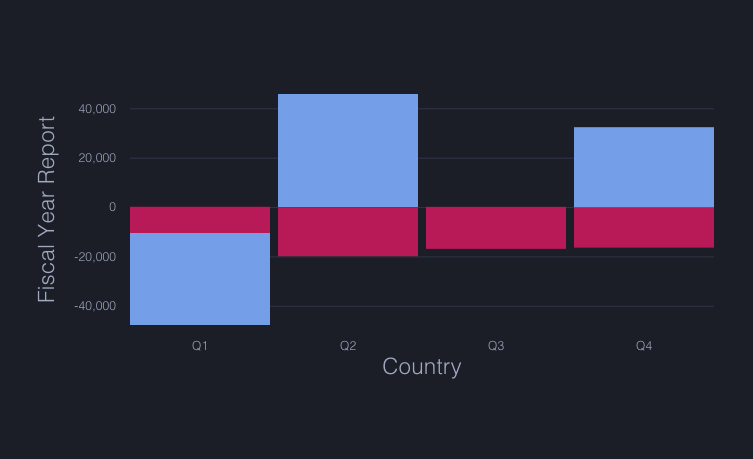
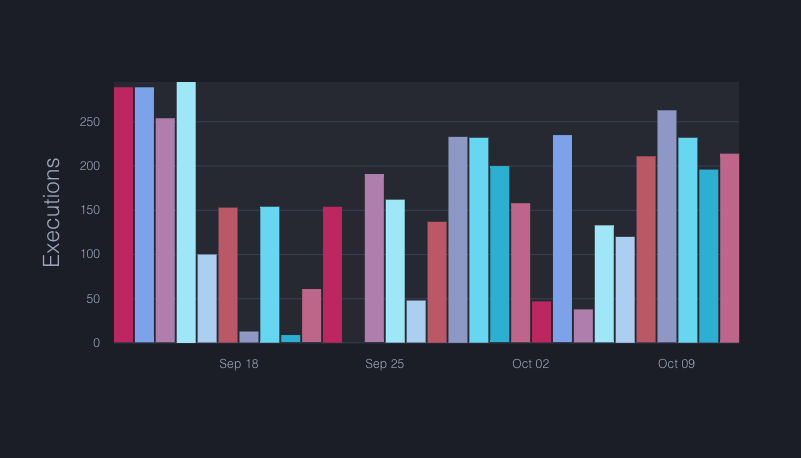
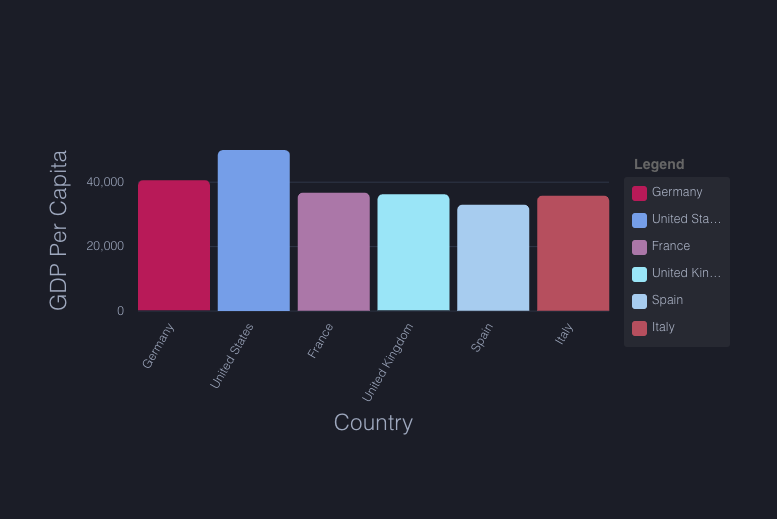
1. vertical bar https://swimlane.github.io/ngx-charts/#/ngx-charts/bar-vertical
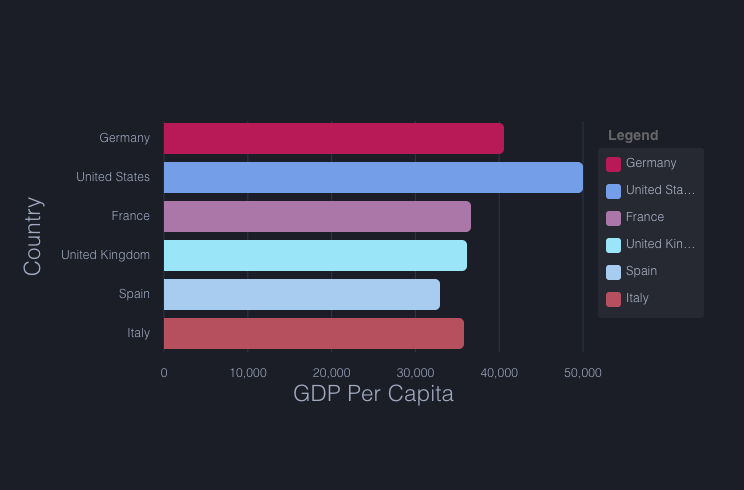
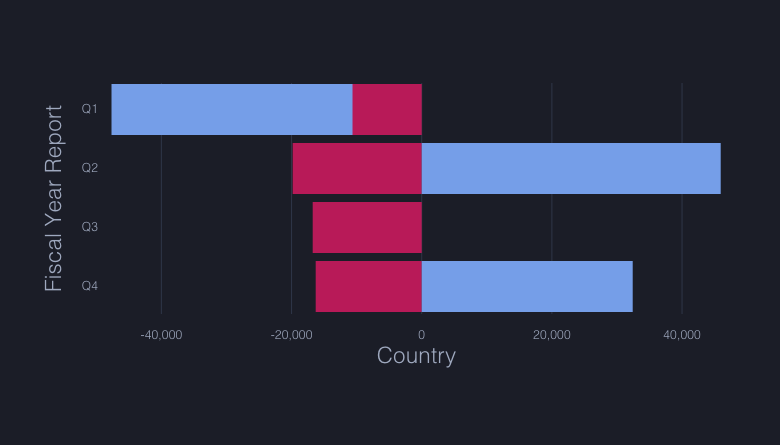
2. horizontal bar https://swimlane.github.io/ngx-charts/#/ngx-charts/bar-horizontal
3. grouped vertical bar chart https://swimlane.github.io/ngx-charts/#/ngx-charts/bar-vertical-2d
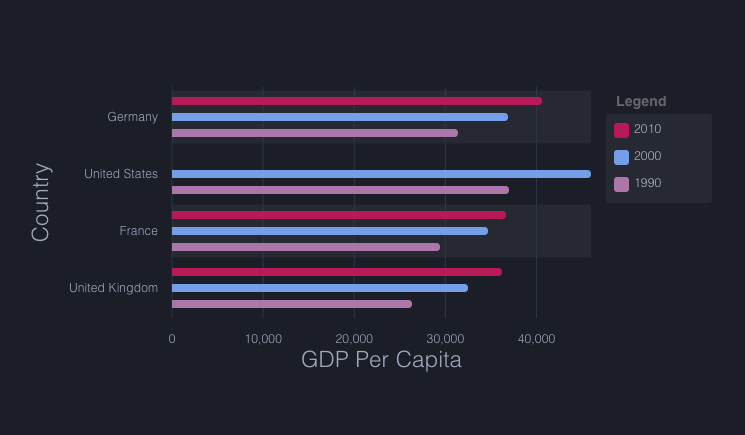
4. grouped horizontal bar chart https://swimlane.github.io/ngx-charts/#/ngx-charts/bar-horizontal-2d
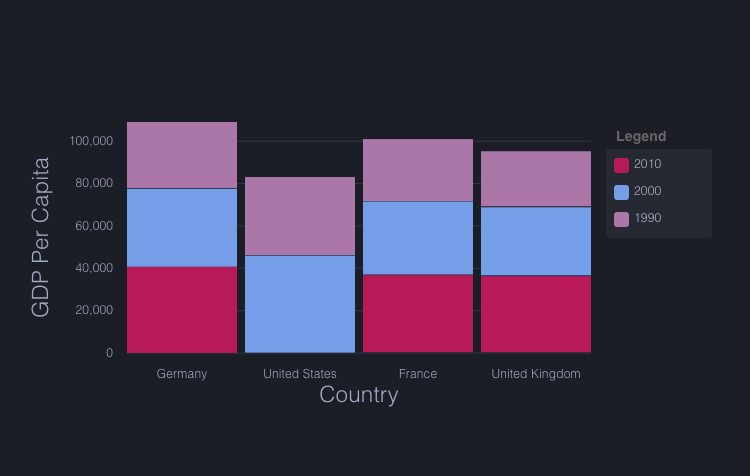
5. stacked vertical bar chart https://swimlane.github.io/ngx-charts/#/ngx-charts/bar-vertical-stacked
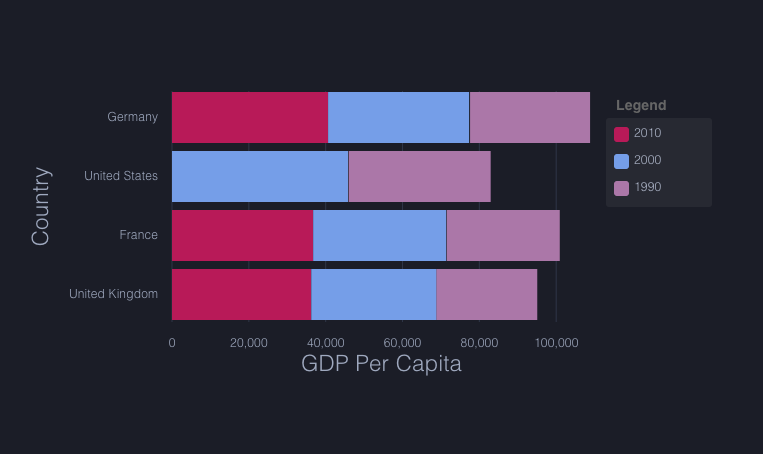
6. stacked horizontal bar chart https://swimlane.github.io/ngx-charts/#/ngx-charts/bar-horizontal-stacked
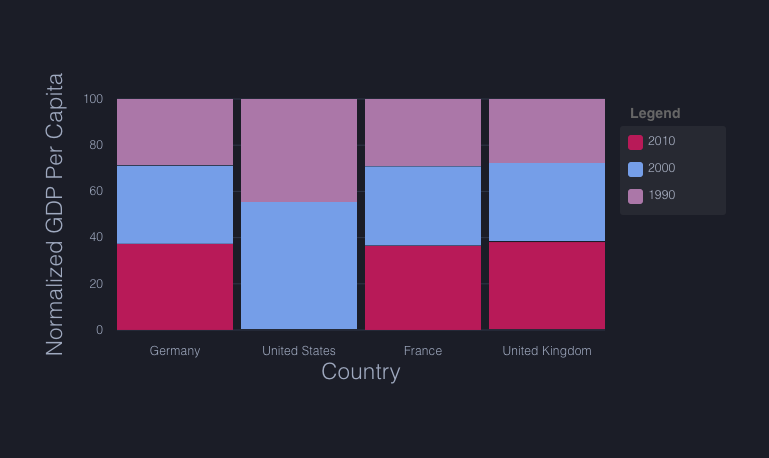
7. normalized vertical bar chart https://swimlane.github.io/ngx-charts/#/ngx-charts/bar-vertical-normalized
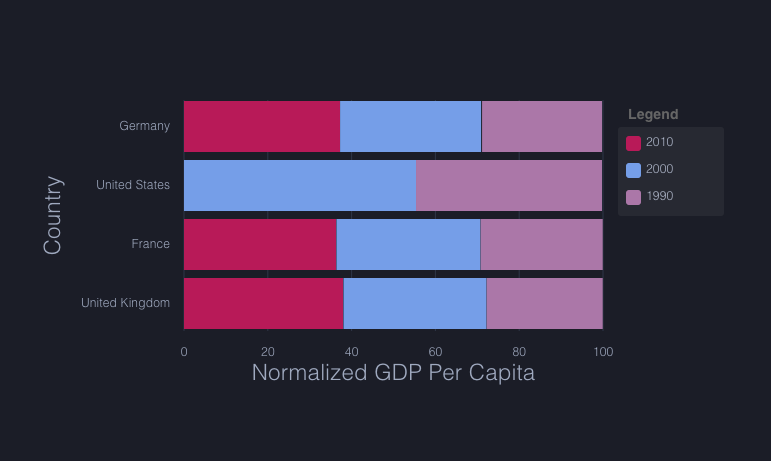
8. normalized horizontal bar chart https://swimlane.github.io/ngx-charts/#/ngx-charts/bar-horizontal-normalized
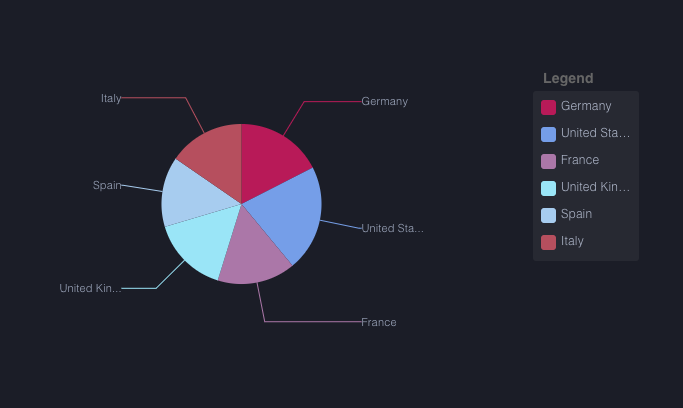
9. pie chart https://swimlane.github.io/ngx-charts/#/ngx-charts/pie-chart
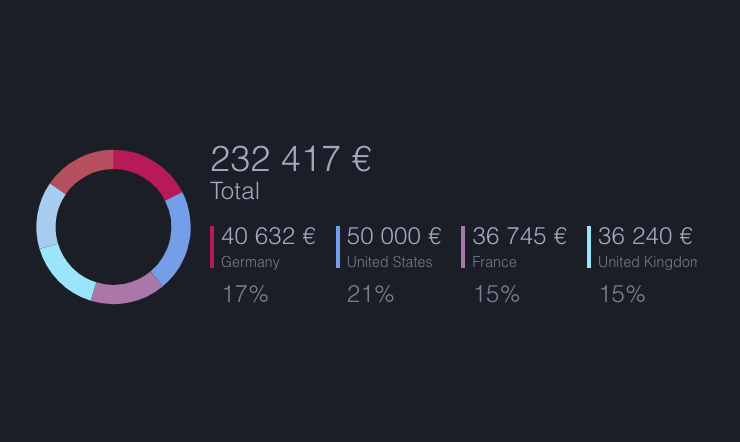
10. advanced pie chart https://swimlane.github.io/ngx-charts/#/ngx-charts/advanced-pie-chart
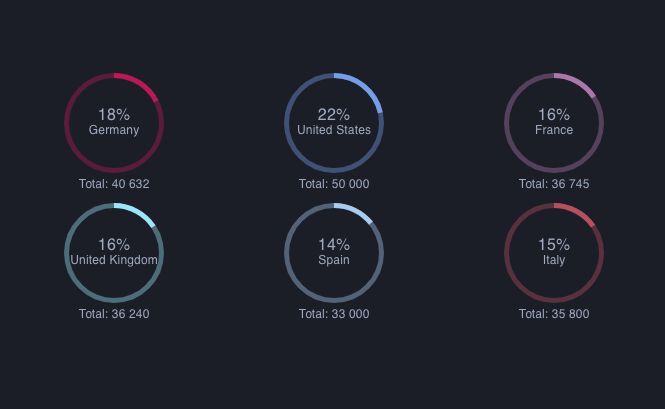
11. pie grid https://swimlane.github.io/ngx-charts/#/ngx-charts/pie-grid
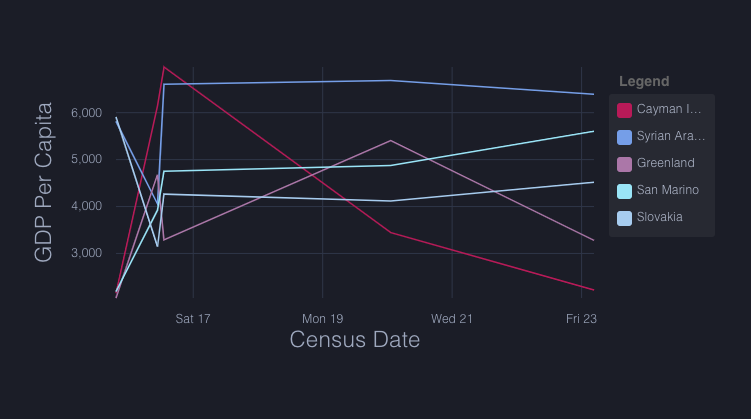
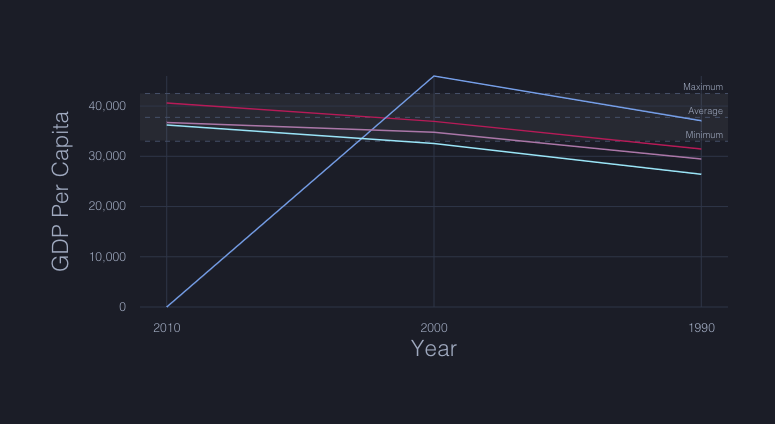
12. https://swimlane.github.io/ngx-charts/#/ngx-charts/line-chart
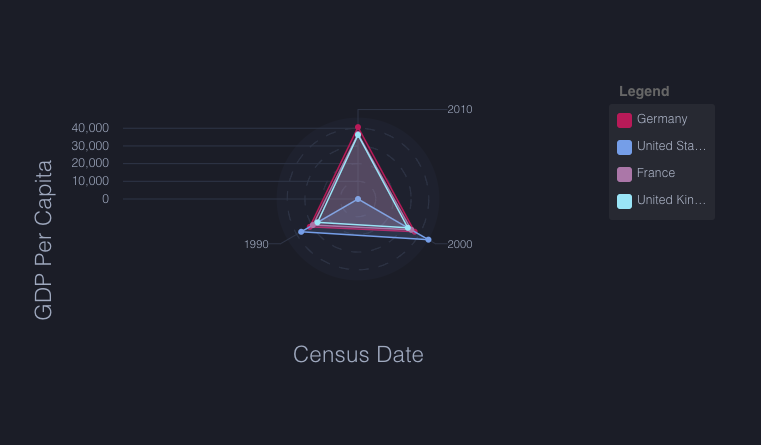
13. polar chart https://swimlane.github.io/ngx-charts/#/ngx-charts/polar-chart
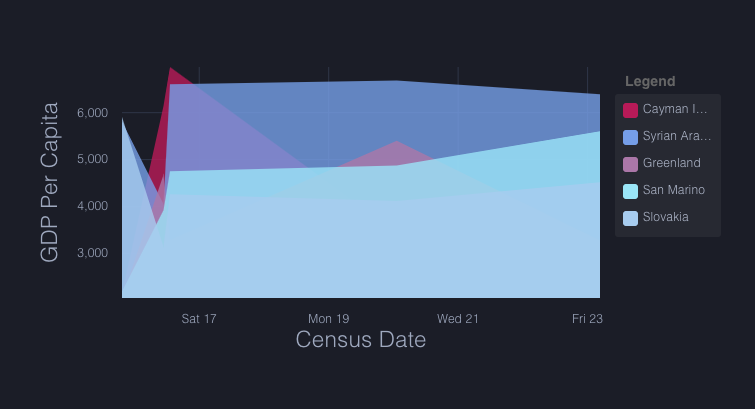
14. area chart https://swimlane.github.io/ngx-charts/#/ngx-charts/area-chart
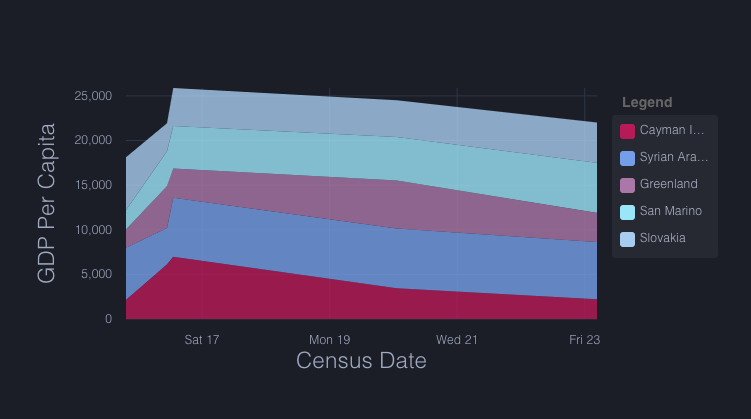
15. stacked area chart https://swimlane.github.io/ngx-charts/#/ngx-charts/area-chart-stacked
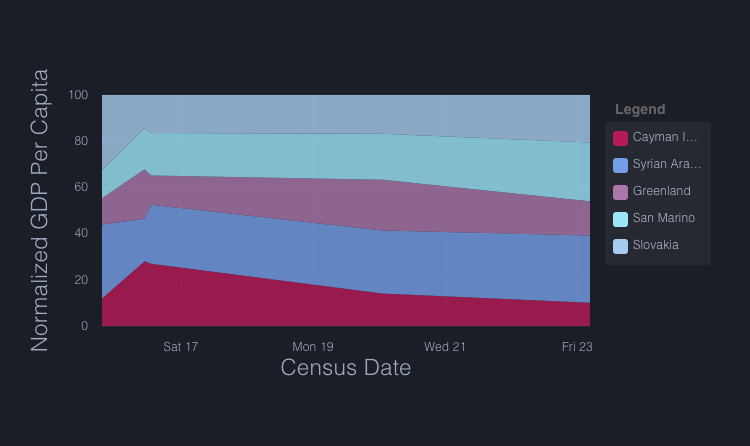
16. normalized area chart https://swimlane.github.io/ngx-charts/#/ngx-charts/area-chart-normalized
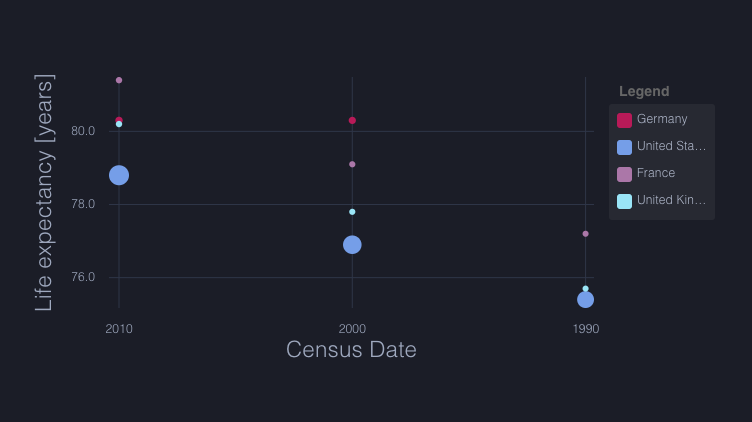
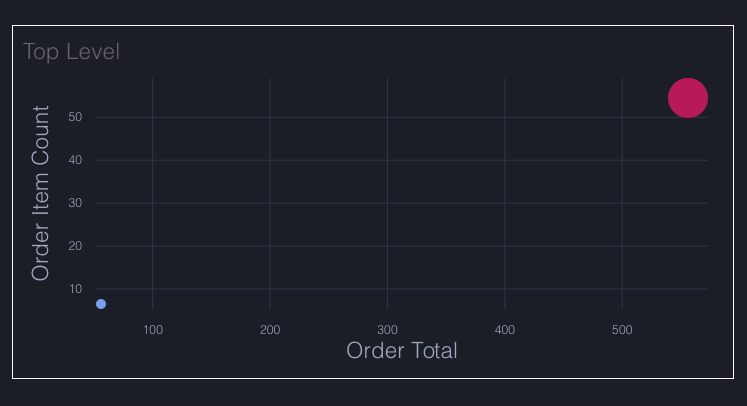
17. bubble chart https://swimlane.github.io/ngx-charts/#/ngx-charts/bubble-chart
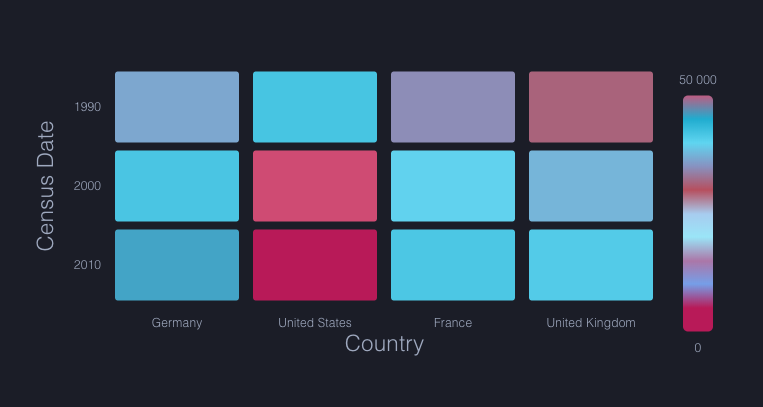
18. heatmap https://swimlane.github.io/ngx-charts/#/ngx-charts/heat-map
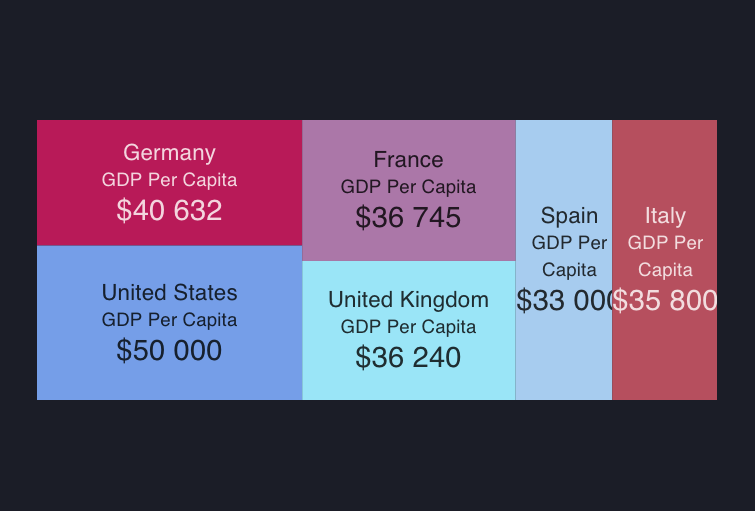
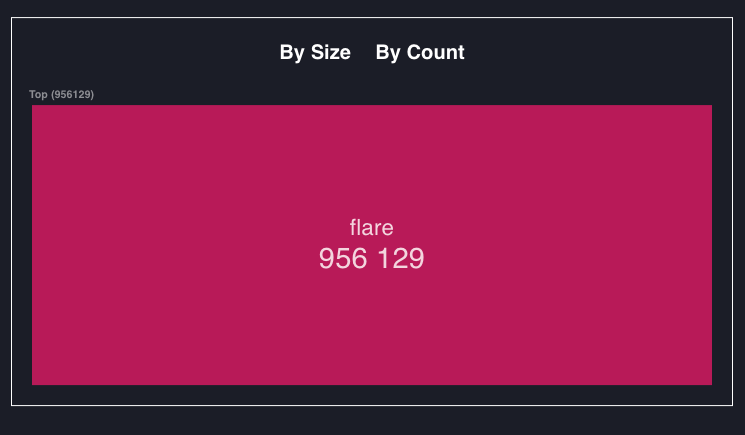
19. treemap https://swimlane.github.io/ngx-charts/#/ngx-charts/tree-map
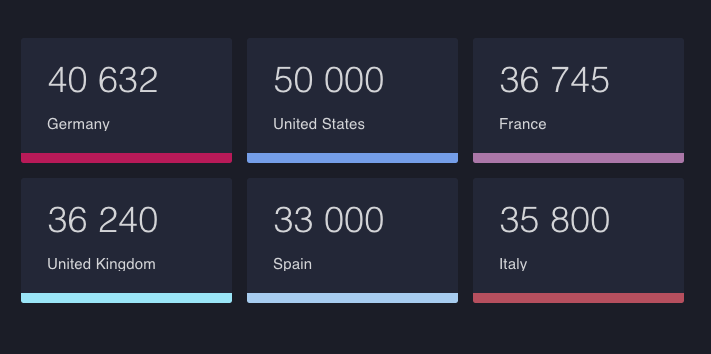
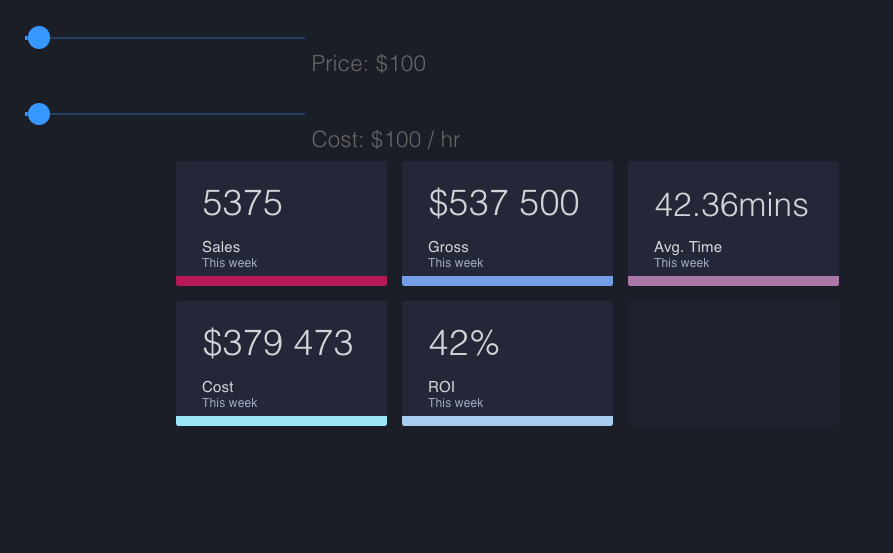
20. number cards https://swimlane.github.io/ngx-charts/#/ngx-charts/number-card
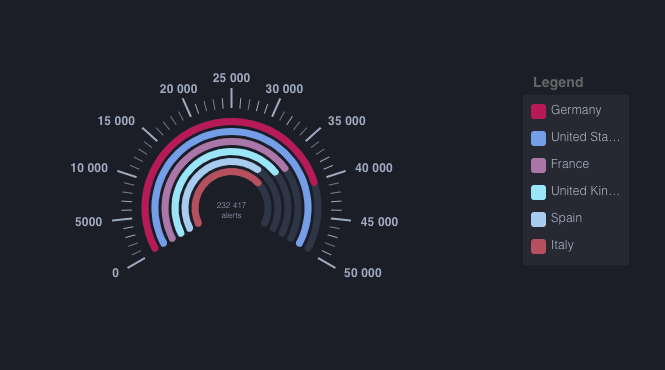
21. gauge https://swimlane.github.io/ngx-charts/#/ngx-charts/gauge
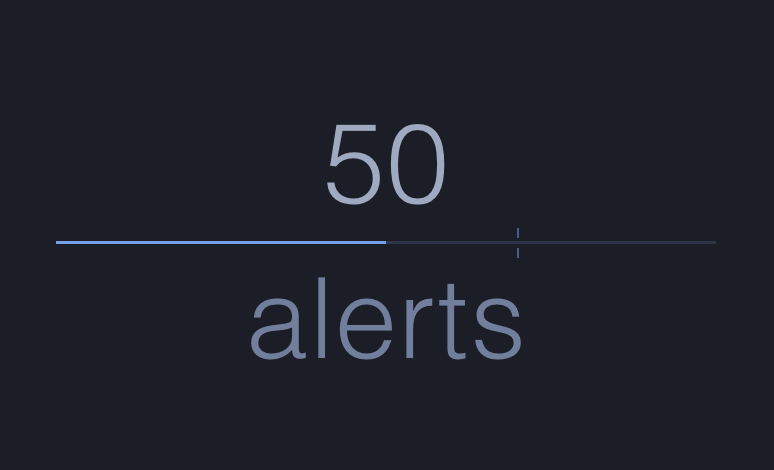
22. linear gauge https://swimlane.github.io/ngx-charts/#/ngx-charts/linear-gauge
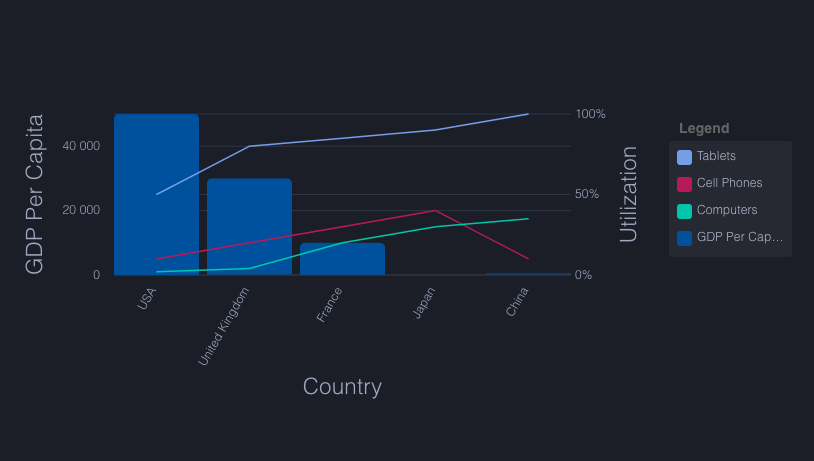
23. combo chart https://swimlane.github.io/ngx-charts/#/ngx-charts/combo-chart
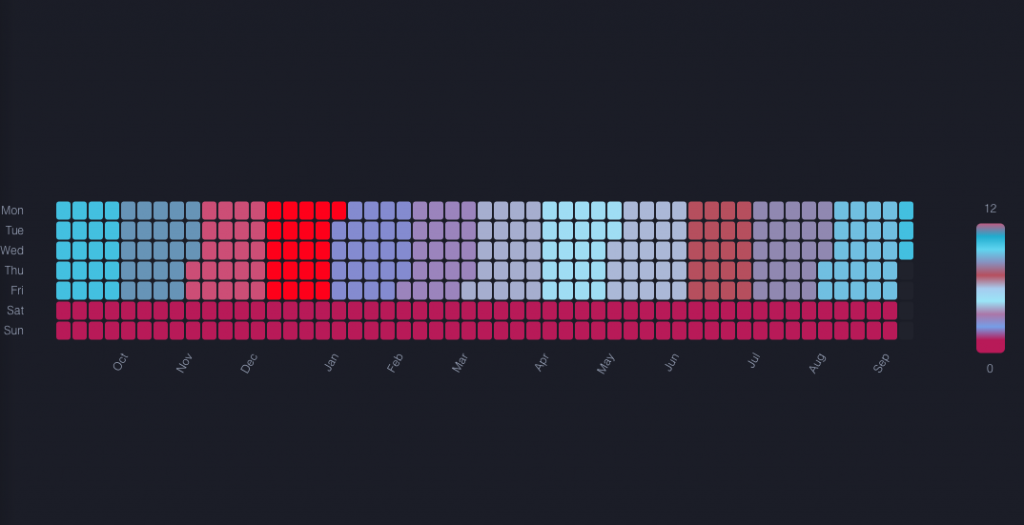
24. heatmap calendar https://swimlane.github.io/ngx-charts/#/ngx-charts/calendar
25. number carts – status https://swimlane.github.io/ngx-charts/#/ngx-charts/status-demo
26. treemap interactive https://swimlane.github.io/ngx-charts/#/ngx-charts/tree-map-demo
27. bubble chart interactive https://swimlane.github.io/ngx-charts/#/ngx-charts/bubble-chart-interactive-demo
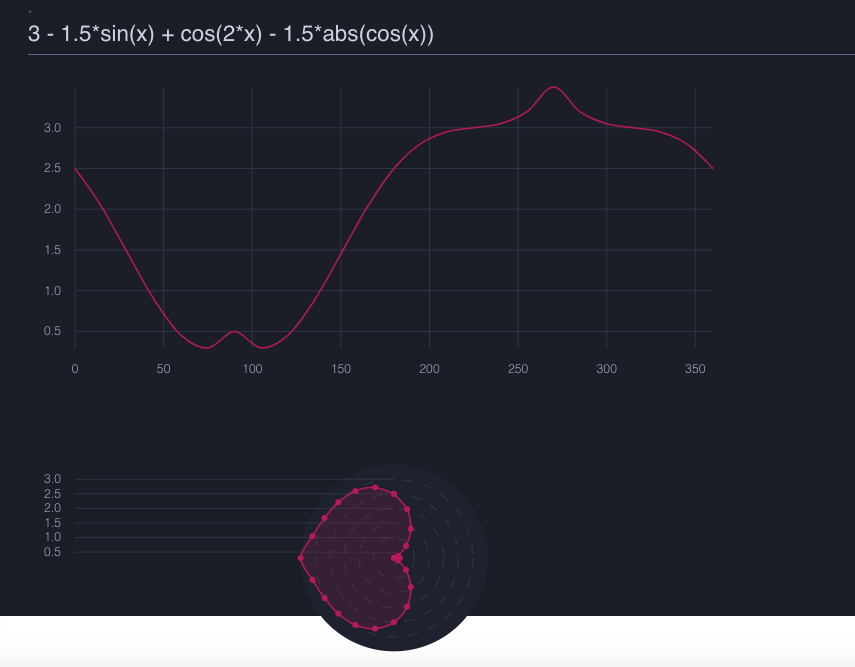
28. equation plots https://swimlane.github.io/ngx-charts/#/ngx-charts/plot-demo
Dependencies
| “d3”: “^4.10.2”, |
| “d3-array”: “^1.2.1”, |
| “d3-brush”: “^1.0.4”, |
| “d3-color”: “^1.0.3”, |
| “d3-force”: “^1.1.0”, |
| “d3-format”: “^1.2.0”, |
| “d3-hierarchy”: “^1.1.5”, |
| “d3-interpolate”: “^1.1.5”, |
| “d3-scale”: “^1.0.6”, |
| “d3-selection”: “^1.1.0”, |
| “d3-shape”: “^1.2.0”, |
| “d3-time-format”: “^2.1.0” |
NPM
https://www.npmjs.com/package/@swimlane/ngx-charts
npm i @swimlane/ngx-charts
Features
- types: horizontal bar chart, vertical bar chart (stacked, standard, normalized, grouped), line chart, bubble chart, pie chart, donut chart, area chart, radial, and lineal gauge chart, force-directed graph, treemap, heatmap, number carts
- possibility to create custom charts
- advanced tooltip configuration
- use of gradients
- disabling tooltips
- trimming axis
- padding between bars
- customization of: time filtering, autoscaling, configurable axis’ labels
- customizing legends (gradient, labels)
- label positioning
- line interpolation
- real-time data support and data point event handlers
- works with ngUpgrade